Dashboard page
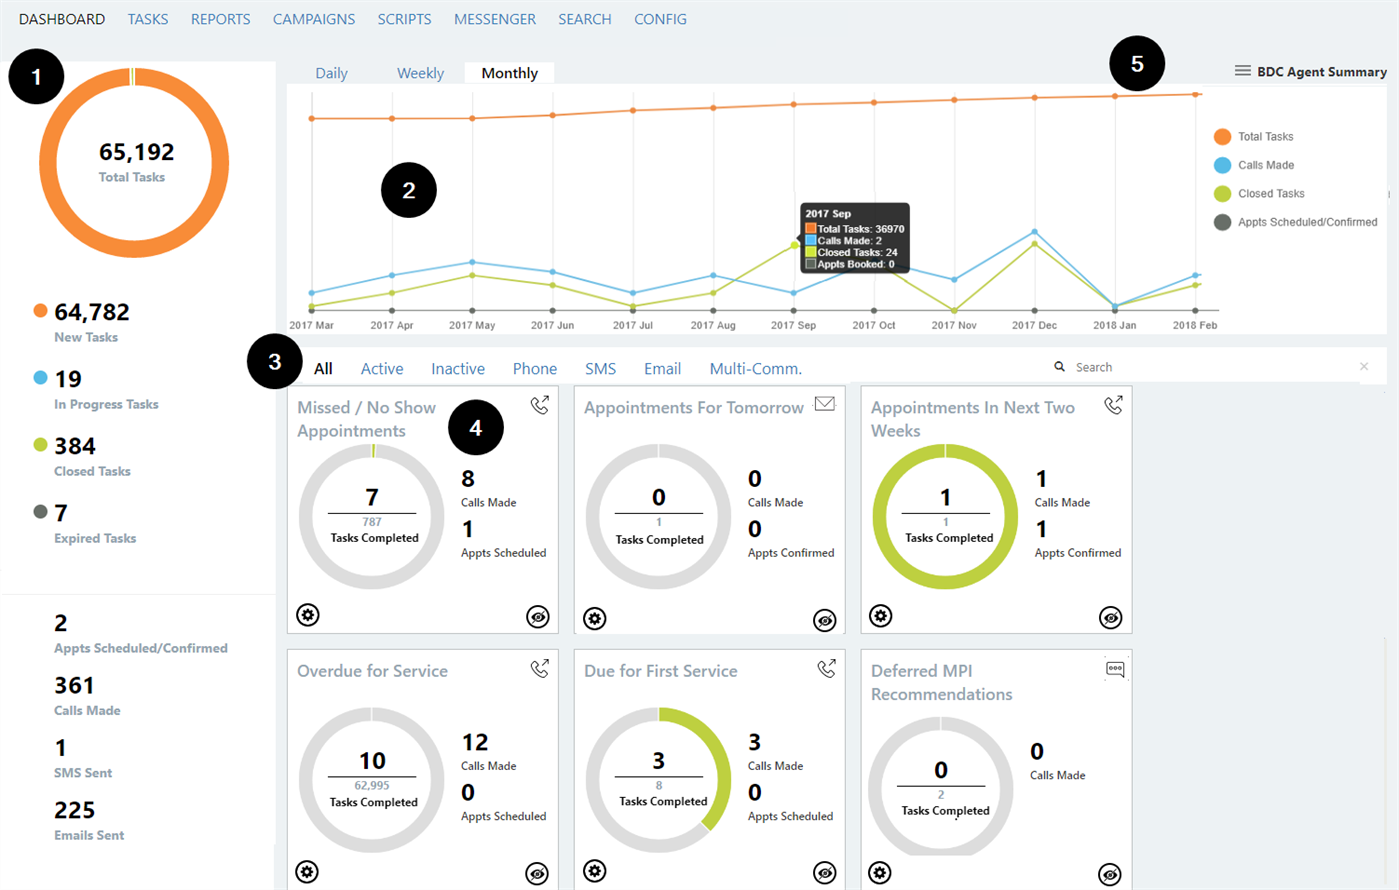
The Dashboard is the first page you see after logging in to the application. The Dashboard page provides a snapshot of the campaigns, tasks and progress of the
If multi-dealer support is enabled at your
Note:
The Dashboard page contains the following information:
- Today’s statistics - This panel provides totals representative of all campaigns and
- Total Tasks: The total number of tasks assigned at the start of the day (new tasks plus incomplete tasks from previous days).
- New Tasks: The number of tasks that have not been started.
- In Progress Tasks: The number of tasks in progress (not yet closed).
- Closed Tasks: The number of tasks closed today.
- Expired Tasks: The number of tasks that expired today.
- Appts Scheduled/Confirmed: The number of appointments booked or confirmed today (depending on the campaign).
- Calls Made: The number of contact attempts (from any campaign type) today.
- SMS Sent: The number of texts sent today (from any campaign type).
- Emails Sent: The number of emails sent today (from any campaign type).
Note: Today's statistics reset daily at 12:01 am. Results are current to the time the application is opened by the user or the page refreshed.
- Historical trends - The line graphs allow the
- Daily statistics are calculated from 12:01 am to midnight, up to the previous day.
- Weekly statistics are calculated from 12:01 am Monday to midnight the following Sunday, up to the previous full week.
- Monthly statistics are calculated by calendar month, up to the previous full month.
- Campaign tiles - The tiles show each campaign’s progress.
- Filter the tiles by type as needed i.e. All, Active, Inactive, Phone, SMS, Email, Multi-Comm.
- Communication type is indicated by an icon:
-
 (phone);
  (SMS);
  (email);
  (multi-comm.)
-
- Click a phone campaign tile to go directly to its task list on the Tasks page as shown in Task Details page. This only applies to phone campaigns as SMS and email campaigns do not have task lists.
- (
 icon to quickly hide the campaign from the dashboard.
 - (
 to go to the campaign's settings. Refer to Campaign settings.
- Each tile shows today's task statistics:
- Tasks Completed/Total Tasks: The number of tasks completed today/Total number of tasks assigned at the start of the day. Progress is shown graphically by the circle.
- Calls Made/Emails Sent/SMS Sent: the number of attempts to contact (depending on the campaign type).
- Appts Scheduled/Confirmed: The number of appointments booked or confirmed (depending on the campaign).
Note: Tile statistics are current to the time the application is opened by the user or the page refreshed.
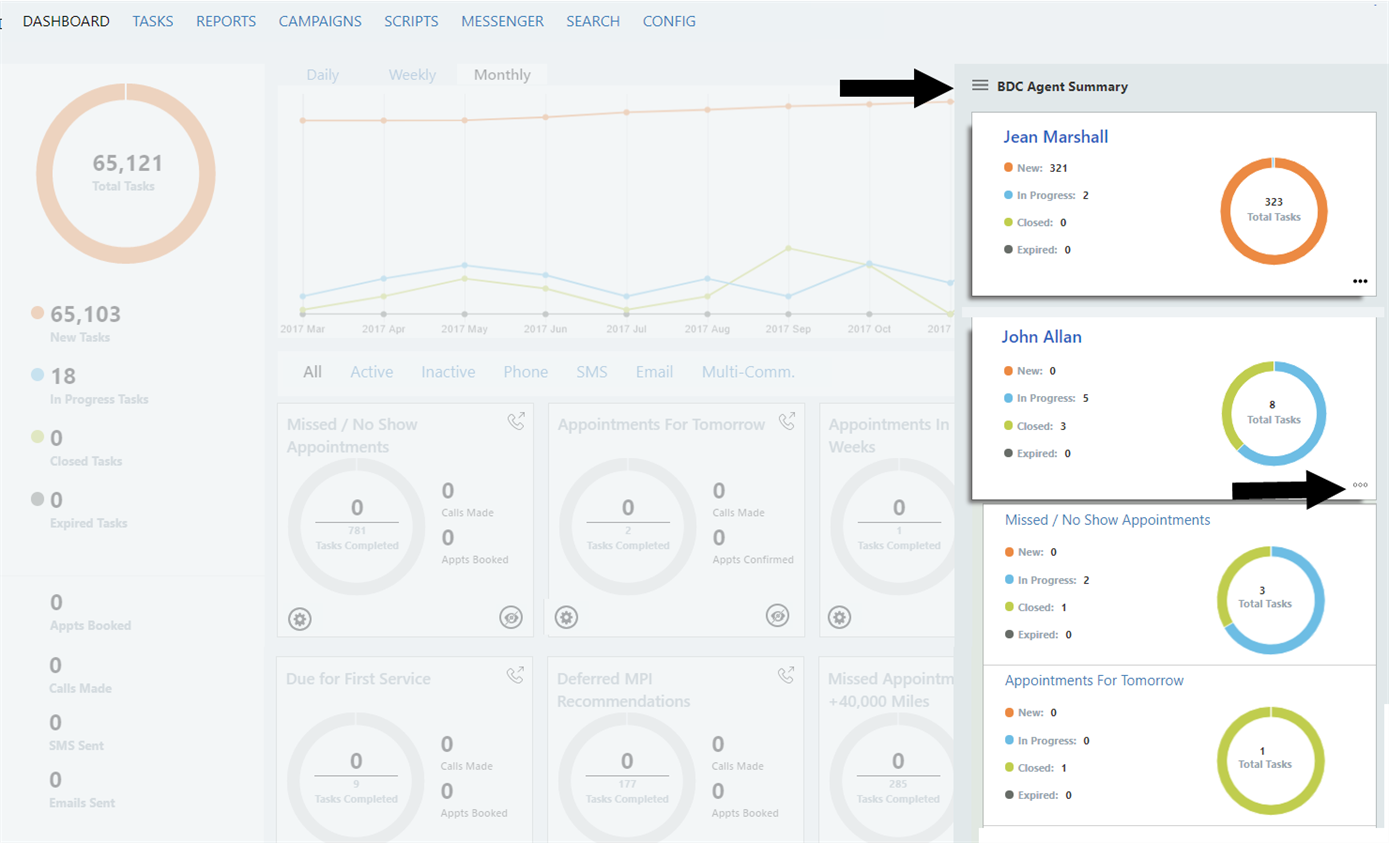
- BDC agent summary (
- Click
 to open and close the panel.
 - Click '...' to see a further breakdown by campaign for the

Choose a tab from the top of the page to work with campaigns and tasks:
- Tasks to work with phone campaign tasks.
- Reports to go to the Reports section.
- Campaigns (for
- Scripts (for
- Messenger to send and review
- Search to quickly access
- Config to adjust
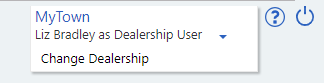
Beside the user and
- Click
 then "Change Dealership" to open
 - Click
 to open online help.
 - Click
 to log out.